Guitar Outline Equation

y = (A*sin(B*x+C) + D*sin(E*x+F) + G*sin(H*x+I) + J*sin(K*x+L)) * (M + N*x + O*x^2 +P*x^3 + Q*x^4) * atan(R*x) * atan(S*(BL-x))

The Nealon Equation

The Guitars

The Arch Tops

The Classicals


webpages and Eos image copyright 2015   M  Nealon

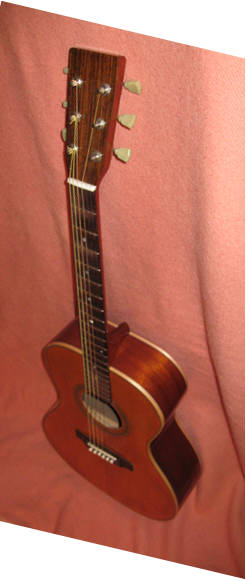
Someday I'll take a picture in focus.

The curve fit is a bit of a mystery. For one thing, the original point series data to which the equation is fit is taken by hand from graph paper and thus may not be very smooth. Because the equation has so many parameters and is quite sensitive to slight variations in the parameters, the smoothness of the original data is critical in producing a smooth curve with the equation.
The effect of the polynomial is not exactly known. Without it the equation (neglecting the arctangent functions for a moment) is similar to a Fourier series, which is a sum of sine functions. A Fourier series approximation of a smooth, continuous function never seems to fit perfectly well, no matter how many terms are included. The series always oscillates around the function, much like the relatively large Gibbs phenomenon which occurs at a jump discontinuity. It appears that the polynomial removes this problem.
The number of sine functions is also critical. These figures are a fit of the Henandez Flamenco guitar near the inflection point between the waist and the lower bout. The first figure is a fit is with seven sine functions and is not very close. Below that is a fit in the same region with eight sines. This fit is quite close. Although the difference is exceedingly small, it is still obvious. The addition of another sine function seems to produce the better fit, since, in the seven sine fit no increase in the number of iterations or decrease in the tolerance in the residuals or parameters would produce a better fit.

Curve Fit

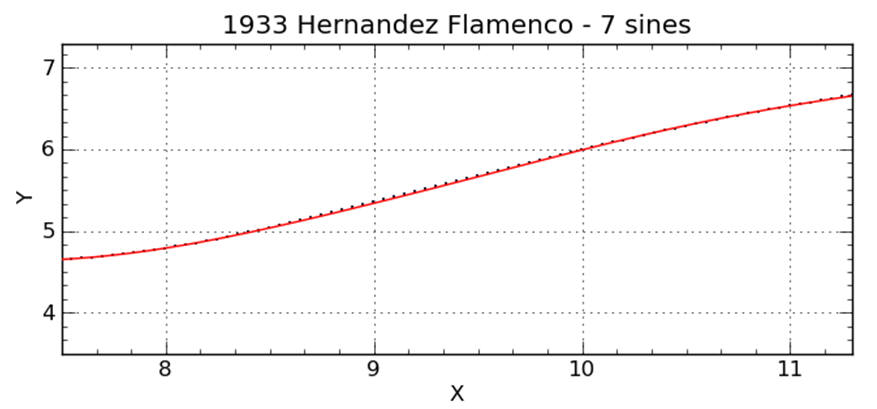
Fit with seven sine functions between the waist and the lower bout.  Note that the red curve (calculation from the equation) clearly misses the insturment data (black dots) at about x = 9".

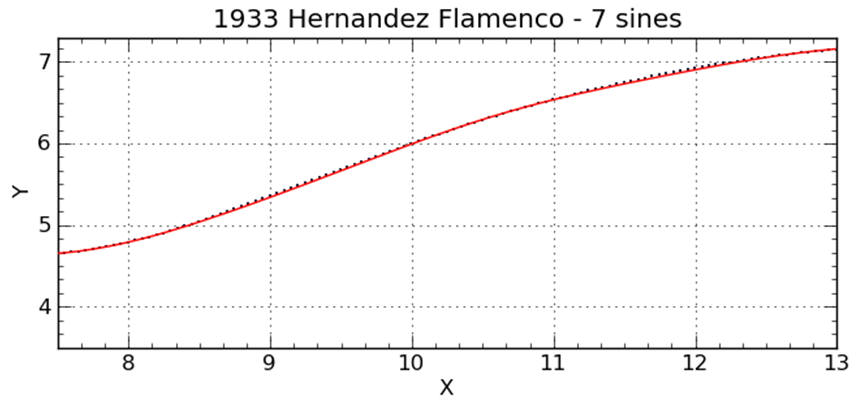
Same instrument, same seven sine fit, showning a bit more of the curve.  Note that the curve misses the data again at about x = 11.5". 

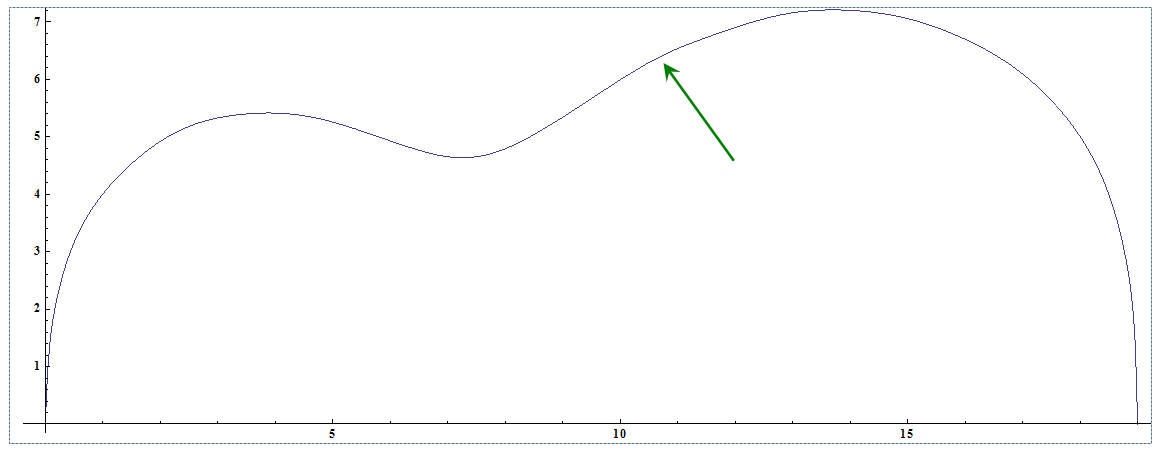
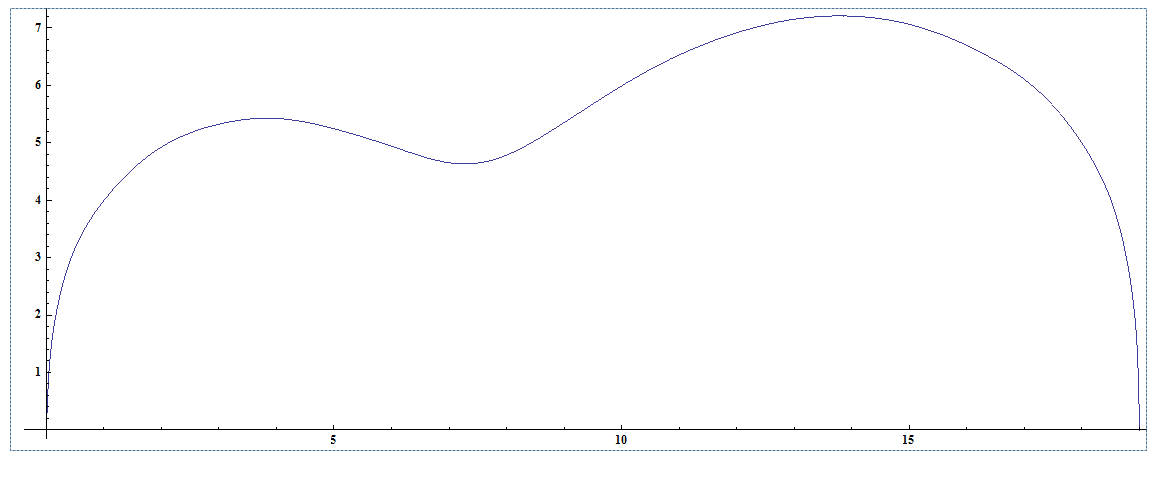
Seven sine fit of the entire side.  The lump (arrow) is obvious.  Drawn in Mathematica.

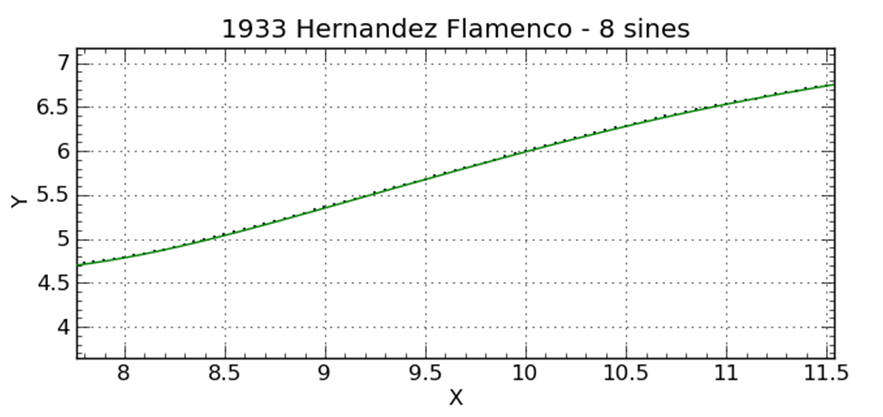
Fit with eight sines along the same region of the guitar.  Note that the curve falls through all of the data making a much better fit.

Eight sines. Looks to me like a better fit.  Drawn in Mathematica.

aaaaaaaaaaaaiii