|
The Nealon Equation |
|
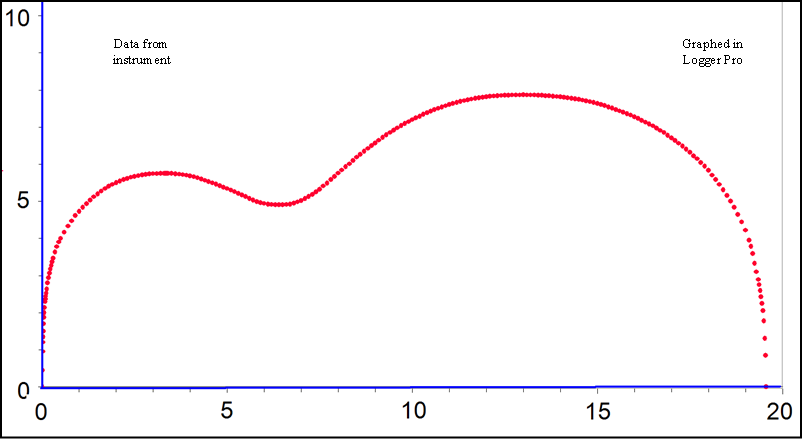
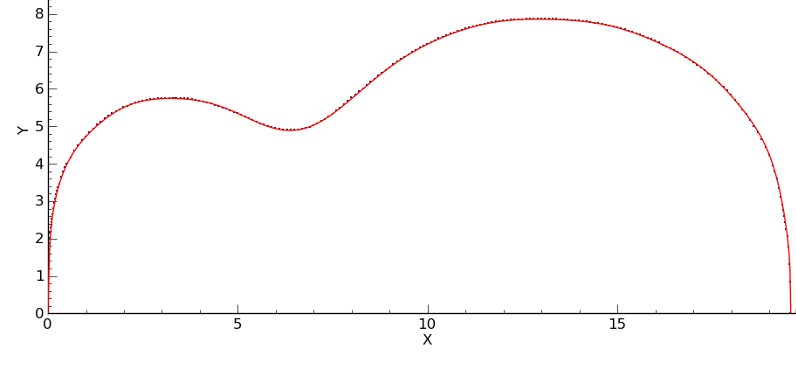
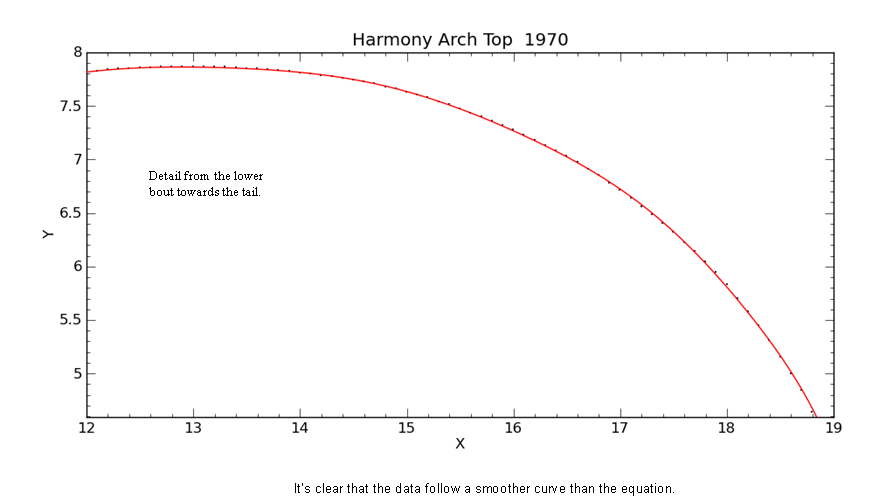
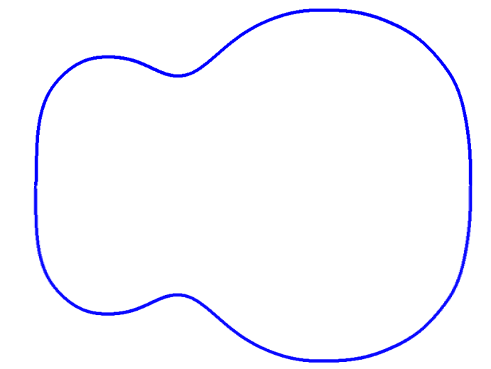
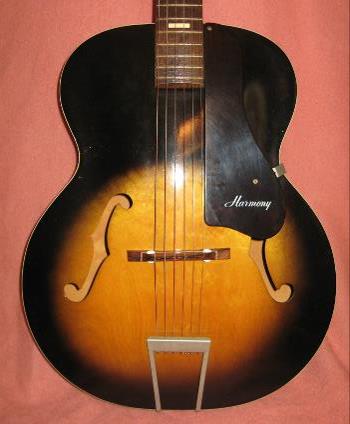
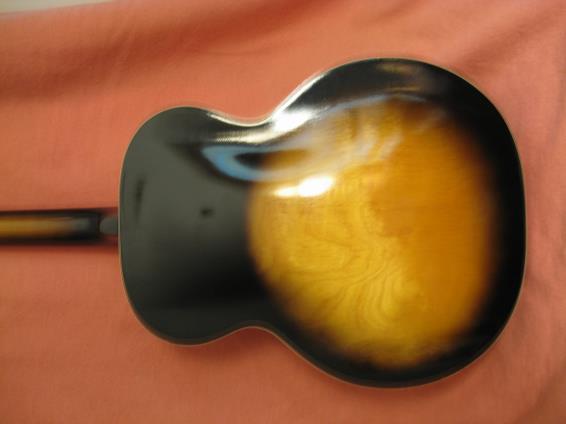
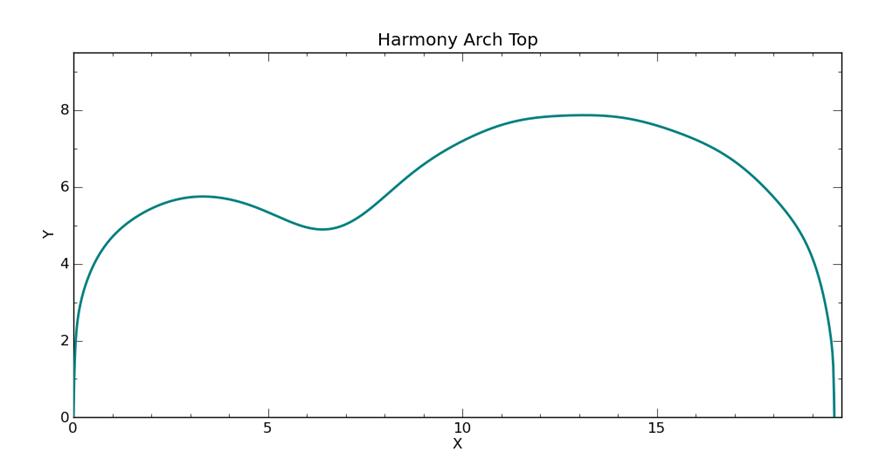
This is the body shape of a Harmony Master built in 1970. It has a non-adjustable steel truss rod and maple top, back and sides. The top and back look like they were formed, not carved, and there is no center seam along top or back, so they must be veneer. Taking the data around the rim is difficult because neither the top nor the back are anywhere close to flat. Projecting the rim onto a piece of graph paper with a half-pencil is the best technique. Holding the instrument level is the hard part. To my eye, this data looks vaguely lumpy and so the curve fit might follow the data. But it is has that nice classic arch-top look: that bulbous shape between the waist and the tail. |
|
y = (A*sin(B*x+C) + D*sin(E*x+F) + G*sin(H*x+I) + J*sin(K*x+L)) * (M + N*x + O*x^2 + P*x^3 + Q*x^4) * atan(R*x) * atan(S*(BL-x)) |
|
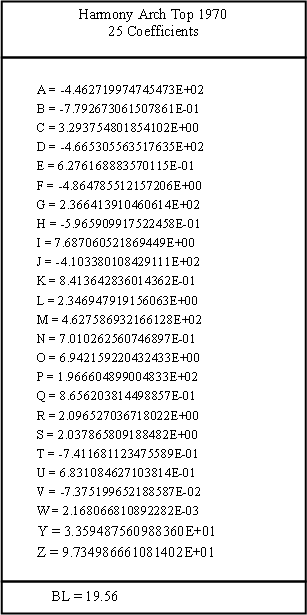
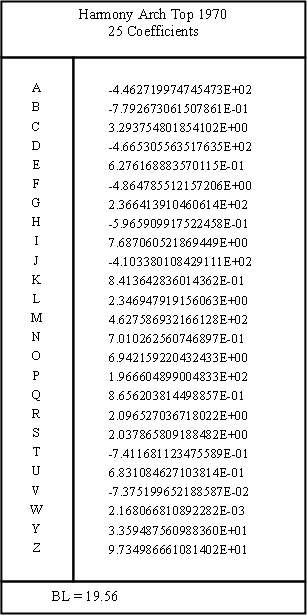
Harmony Arch Top 1970 |
|
(A*sin(B*x+C) + D*sin(E*x+F) + G*sin(H*x+I) + J*sin(K*x+L) + M*sin(N*x+O) +P*sin(Q*x+R)) * (S + T*x + U*x^2 + V*x^3 + W*x^4) * atan(Y*x) * atan(Z*(19.56-x)) |
|
y = (A*sin(B*x+C)+D*sin(E*x+F)+G*sin(H*x+I)+J*sin(K*x+L))*(M+N*x+O*x^2+P*x^3+Q*x^4)*atan(R*x)*atan(S*(19.56-x)) |
|
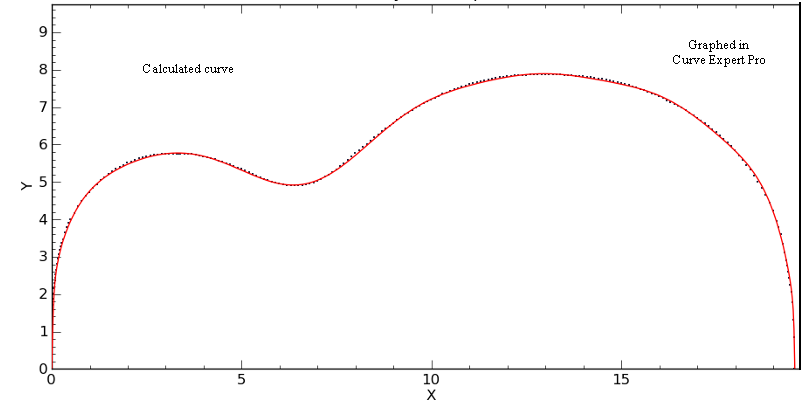
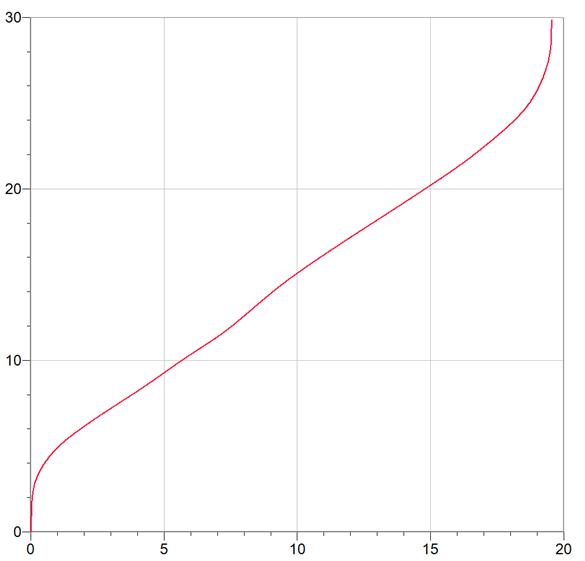
It is the curve that is a bit lumpy, not the data. The fit is especially poor between the lower bout and the tail. This is the best curve I could find with nineteen coefficients. See below for a better fit. |


|
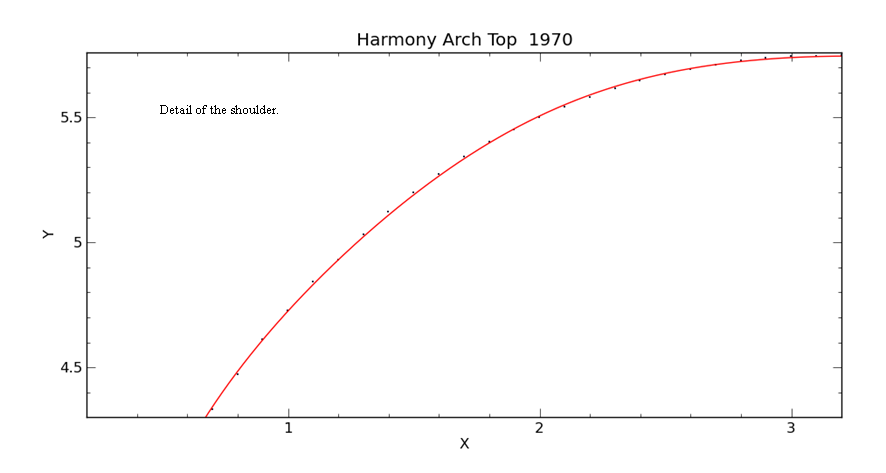
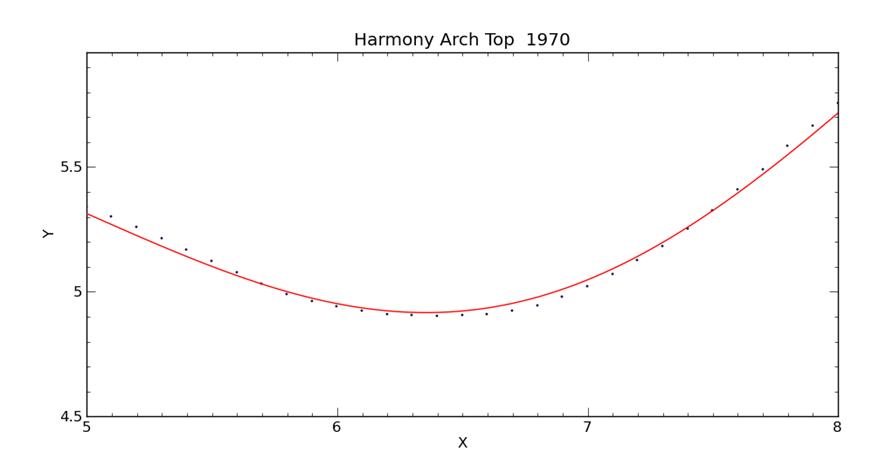
Detail of the fit at the waist. The x-axis and y-axis are on the same scale, so this is a realistic view. The guitar has a 9.8” wide waist which falls at x = 6.4”. The local minimum of the curve at the waist (orange arrow) seems to line up pretty well with the minimum in the data at the waist, within about .05 inches along the x-axis. At the black arrows, the curve missed the data by .034”. |
|
\\\\\\\\\\\\\\\\\\\\\\\\\\\\\\\\\\\\\\\\\\\\\\\\\\\\\\\\\\\\\\\\\\\\\\\\\\\\\\\\\\\\\\\\\\\\\\/////////////////////////////////////////////////////////////////////////////////////////////
/////////////////////////////////////////////////////////////////////////////////////////////\\\\\\\\\\\\\\\\\\\\\\\\\\\\\\\\\\\\\\\\\\\\\\\\\\\\\\\\\\\\\\\\\\\\\\\\\\\\\\\\\\\\\\\\\\\\ |
|
I managed to find a better fit by increasing the number of sine terms. I did all of the initial curve fitting with Curve Expert Basic, which limits the number of coefficients to 19. Curve Expert Pro allows unlimited coefficients. By adding two more sine terms I increased the number of coefficients to 25. Note that they are still in alphabetical order. The polynomial and arctangent coefficients have been renamed. Lucky we have 26 letters in the alphabet. |
|
I can see even on this scale that this is a better fit. This curve is still not perfect, so if I add just a couple more sine . . . . perhaps my obsession has gone just a bit too far. |
|
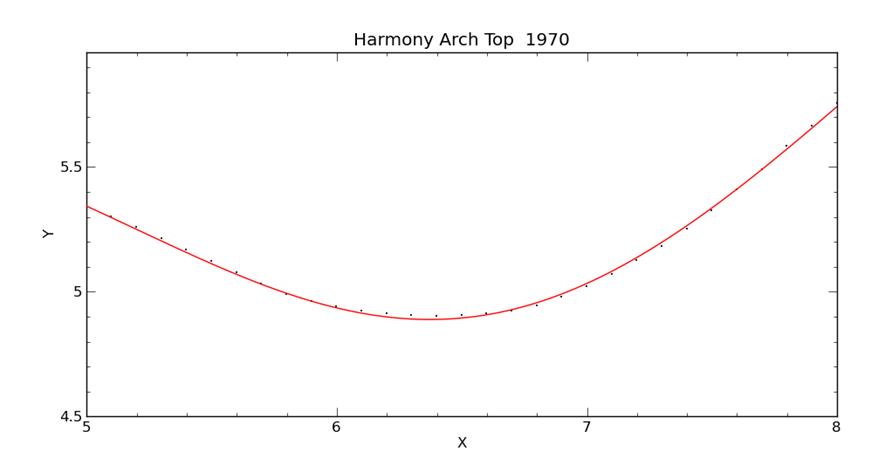
This is the waist area in the same view as above showing the better fit. Here, the curve’s maximum deviation from the data is a mere .017”. |
|
0.017” |
|
0.034” |
|
|
|
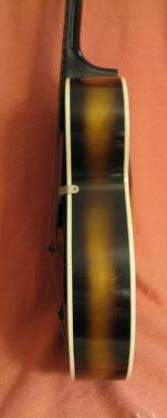
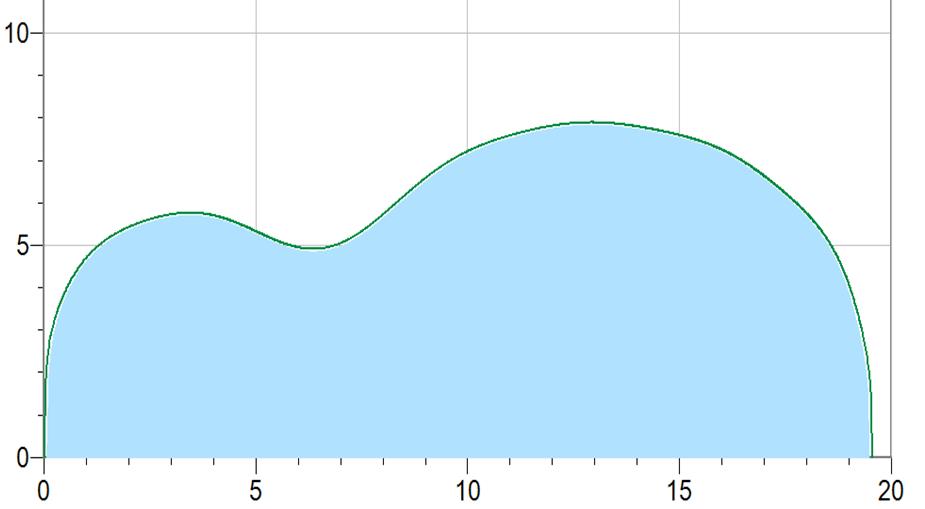
Total length of side = 29.85 inches |
|
Harmony Arch Top graphed with original (somewhat lumpy) curve fit Inside area = 117.5 square inches |
|
(A*sin(B*x+C) + D*sin(E*x+F) + G*sin(H*x+I) + J*sin(K*x+L) + M*sin(N*x+O) +P*sin(Q*x+R)+AA*sin(BB*x+CC)) * (S + T*x + U*x**2 + V*x**3 + W*x**4) * atan(Y*x) * atan(Z*(19.56-x)) |
|
A = -2.762680599244219E+02 B = -6.359720120682217E-01 C = 3.666271319450936E+00 D = -5.311974580229260E+02 E = 5.254459821410579E-01 F = -3.564771919942139E+00 G = 3.240562462413853E+02 H = -5.079882487804610E-01 I = 6.546560330175870E+00 J = -7.283502000831003E+02 K = 6.141820310209362E-01 L = 2.090244974088706E+00 M = 7.027505841269388E+02 N = 5.882283578922181E-01 O = 8.479044430523715E+00 P = 1.322299191586955E+02 Q = 6.455432081082175E-01 R = 4.541355662263070E-01 AA = -1.751756313291612E-03 BB = 1.965537844930202E+00 CC = -5.337363693497752E+00 S = 4.925593926284641E+00 T = -1.095718636233621E+00 U = 6.001617702504378E-01 V = -6.563777018478478E-02 W = 2.046777594889484E-03 Y = 3.057932805771013E+01 Z = 7.555543380063627E+01 |
|
Last attempt to find a better fit. This is the form of the equation with 28 coefficients (seven sines) and it is only a marginally better fit. I began with the coefficients for the Grellier Gibson L-00 1940 blueprint, and let the program run through its iterations.
Chi squared = .02125 Number of iterations = 27,000
It still looks a little lumpy so I think that the curve must be trying to follow the lumpiness in the raw data. Oh, well. |