|
The Nealon Equation |
|
y = (A*sin(B*x+C) + D*sin(E*x+F) + G*sin(H*x+I) + J*sin(K*x+L)) * (M + N*x + O*x^2 + P*x^3 + Q*x^4) * atan(R*x) * atan(S*(BL-x)) |

|
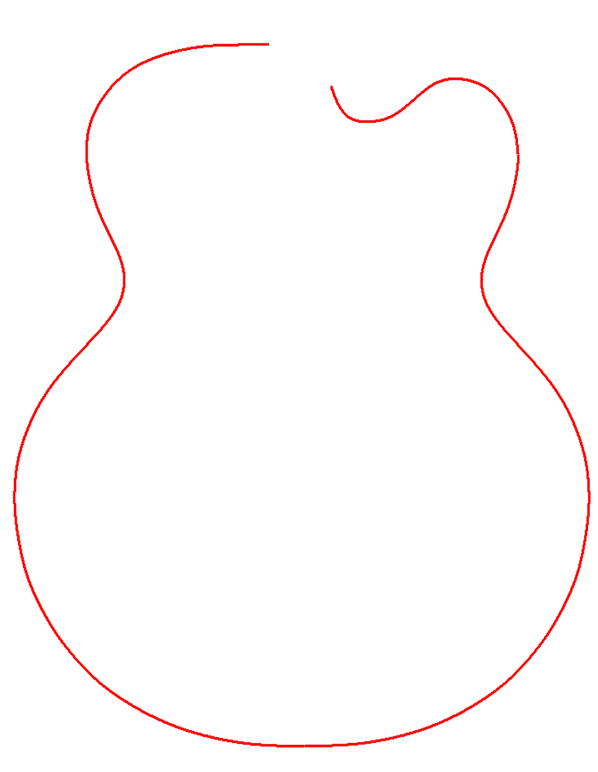
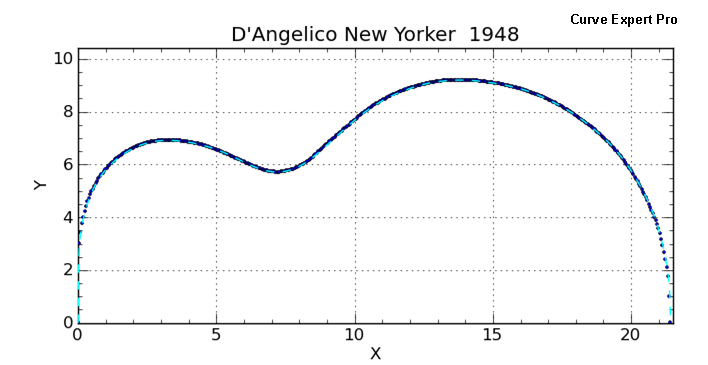
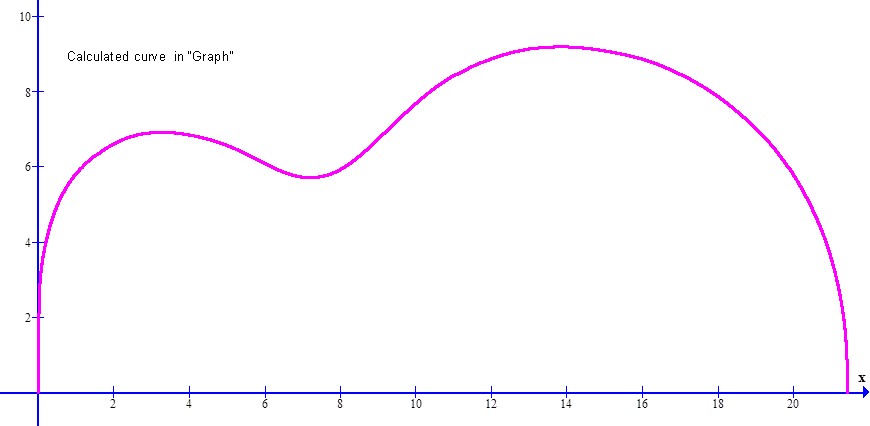
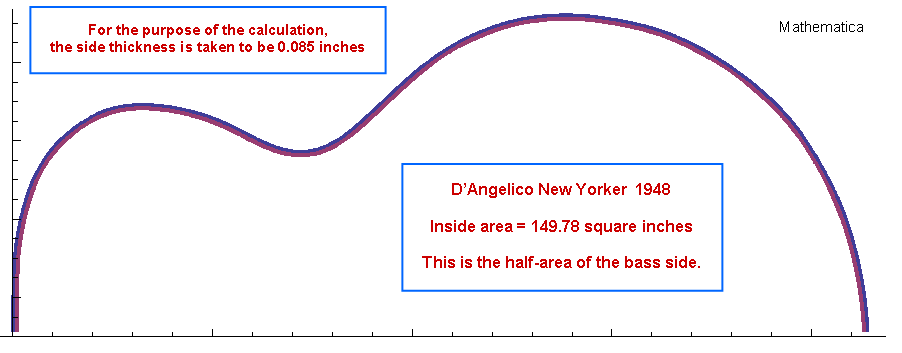
D’Angelico New Yorker 1948
|
|
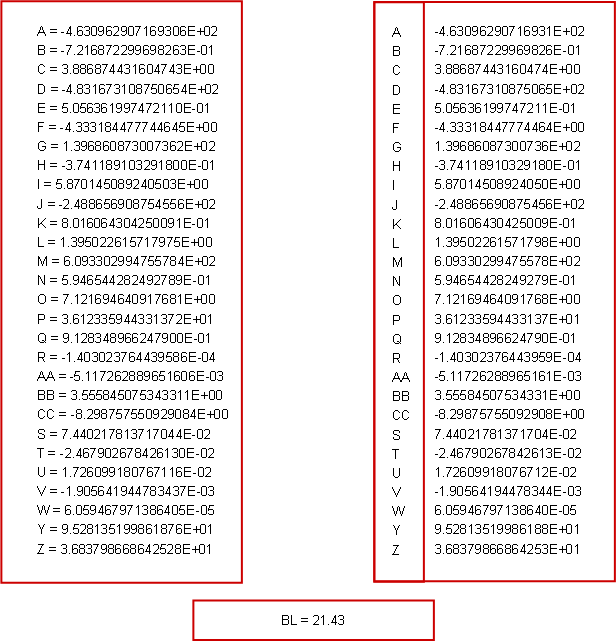
(A*sin(B*x+C) + D*sin(E*x+F) + G*sin(H*x+I) + J*sin(K*x+L) + M*sin(N*x+O) +P*sin(Q*x+R)+AA*sin(BB*x+CC)) * (S + T*x + U*x^2 + V*x^3 + W*x^4) * atan(Y*x) * atan(Z*(21.43-x)) |
|
D’Angelico New Yorker 1948 Arch Top 28 Coefficients |
|
|
|
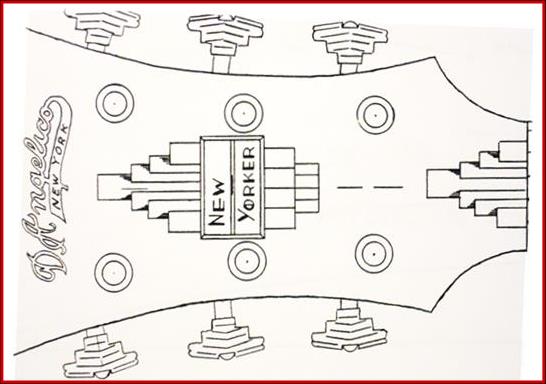
Instrument Plan |
|
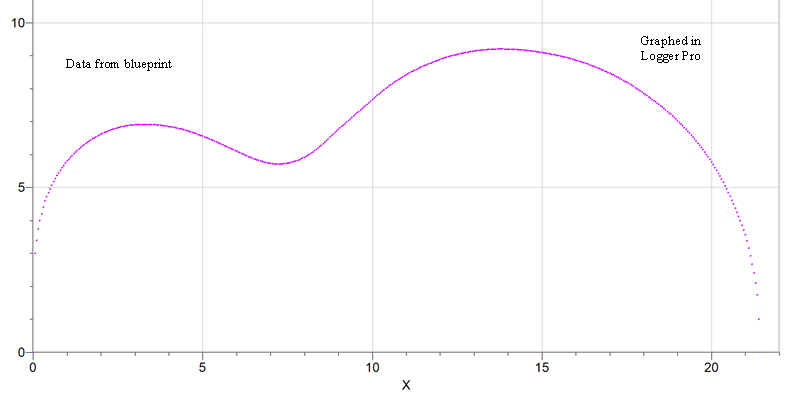
Comparison of blueprint data with calculated curve of the base side of the 1948 D’Angelico New Yorker. Data are the dots and the calculated curve is the dashed light blue line. This fit was made in Curve Expert Pro using the coefficients for the Grellier Gibson L-00 as initial guesses. The fit was fast and precise.
Chi squared (standard error) for this fit is 0.0091792. Correlation Coefficient : 0.999984 |
|
y = (A*sin(B*x+C)+D*sin(E*x+F)+G*sin(H*x+I)+J*sin(K*x+L))*(M+N*x+O*x^2+P*x^3+Q*x^4)*(3.735-atan(R*x))*atan(S*(5.835-x)) |
|
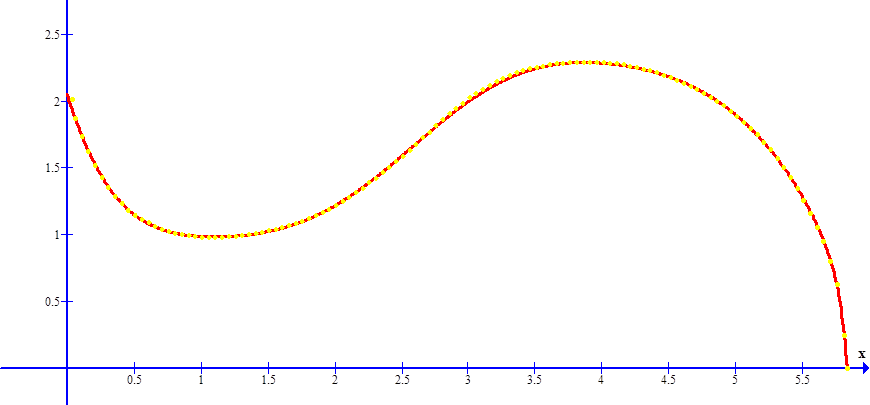
D’Angelico Cutaway 19 Coefficients |
|
-1.143616531442276E-02 -1.639878209605865E+00 -1.960668168880811E+01 2.677281614634245E+00 -6.641178810293005E-01 6.335785128890824E-01 1.428240717963398E+00 -7.218282815799651E-02 3.889236242172479E-01 2.530305789682314E+00 -6.587316037152285E-01 3.760312253712935E+00 5.251629815438947E-01 -7.686667551259281E-01 9.283613491998271E-01 -4.824465759513422E-01 1.151695988764359E-01 -5.234083641145491E-01 2.389878862075655E+01
|
|
A = -1.143616531442276E-02 B = -1.639878209605865E+00 C = -1.960668168880811E+01 D = 2.677281614634245E+00 E = -6.641178810293005E-01 F = 6.335785128890824E-01 G = 1.428240717963398E+00 H = -7.218282815799651E-02 I = 3.889236242172479E-01 J = 2.530305789682314E+00 K = -6.587316037152285E-01 L = 3.760312253712935E+00 M = 5.251629815438947E-01 N = -7.686667551259281E-01 O = 9.283613491998271E-01 P = -4.824465759513422E-01 Q = 1.151695988764359E-01 R = -5.234083641145491E-01 S = 2.389878862075655E+01
|
|
BL = 5.835 |
|
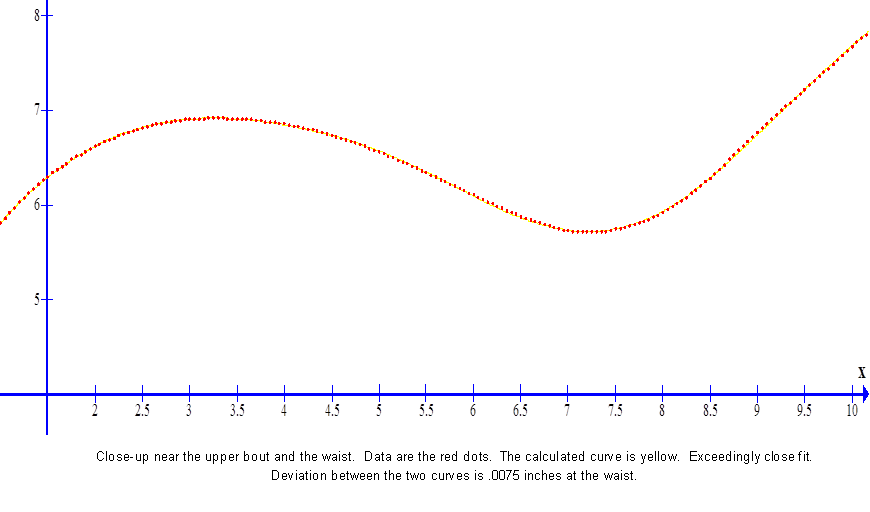
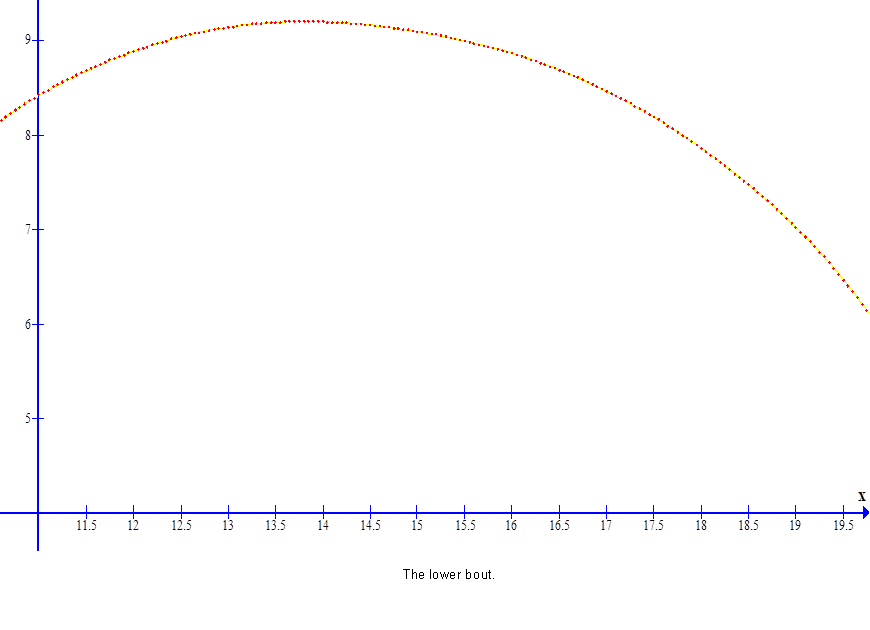
The red line is the calculated curve; the yellow dots are the data. |
|
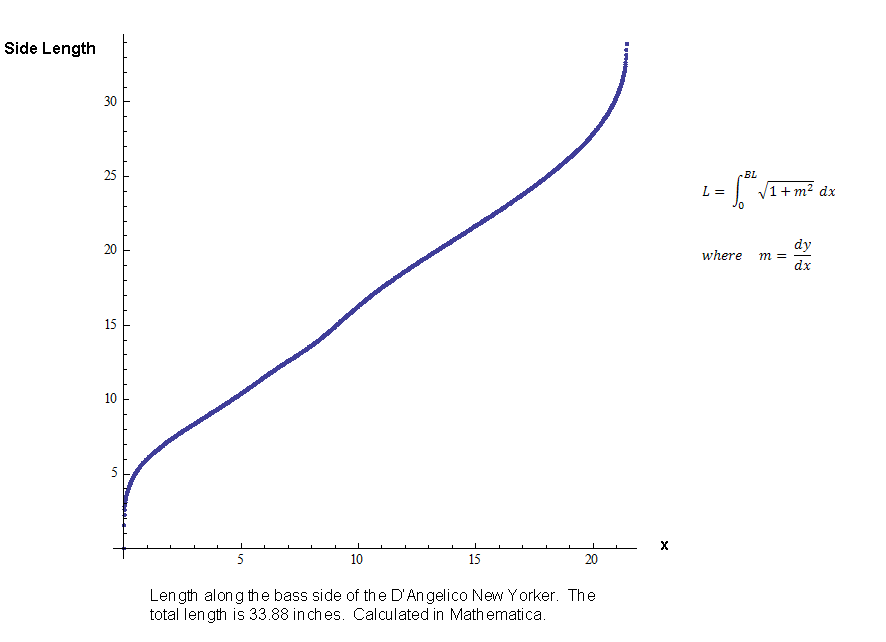
Hours are required to take this much data, to be sure that it is smooth, and that it follows the blueprint very closely. The smoother the data, the better the fit. Imagine that. |